chart analysis

When the Thrill Is Gone

We’ve talked before about how the ups and downs of the market are like being on a rollercoaster. The anticipation, the buildup—those things don’t have to be scary when we understand they’re part of the ride. For some, they’re even thrilling. 

This comparison is a little simplistic, sure. But there are valuable lessons in this image. 

For instance, one difference between the markets and actual rollercoasters is that the peaks and valleys of the stock charts aren’t being designed by skilled engineers. Charts are historical: their goal is to map the ride that happened, not the best possible ride. 

Take this example: as shown in the chart below, this company’s stock price climbed quickly during the tech boom. You can almost hear the coaster gaining steam—nearly vertical.  

graph shows a big climb

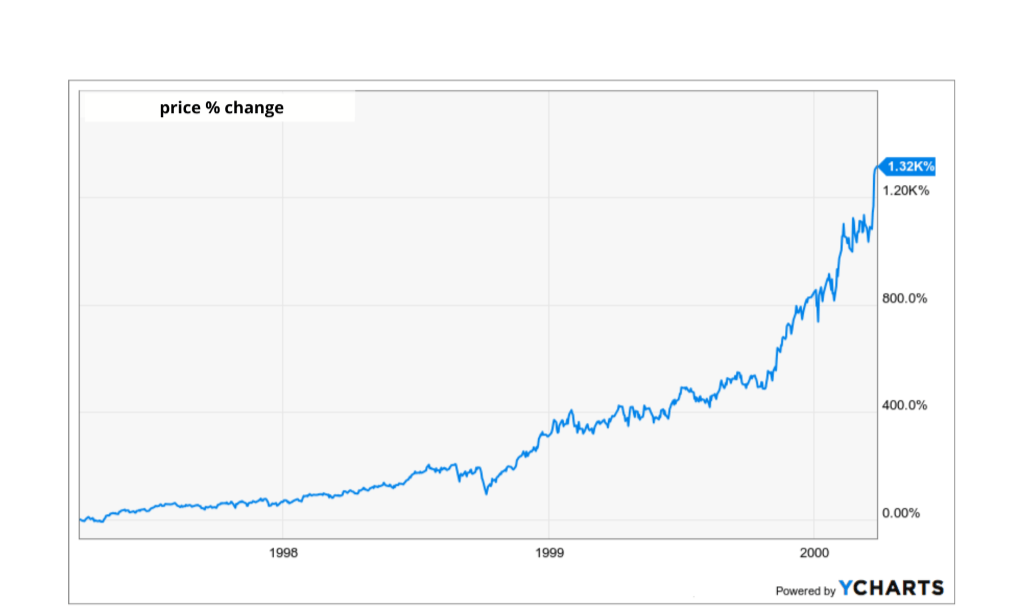
The company’s pre-2000 ascent. 

And then, as with all thrill rides, the drop (pictured below). Some investors aren’t sure which fell faster: the price or their stomachs. A rollercoaster engineer would be able to design that part in a way that riders would forgive them the jarring rise and fall.  

But what came next would probably get a rollercoaster engineer fired. 

graph shows a sharp drop

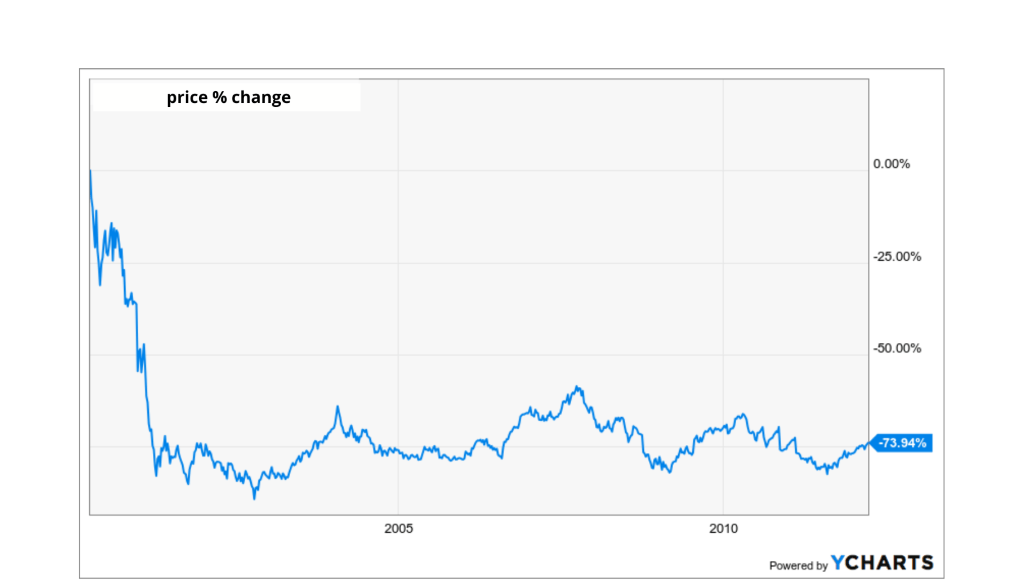
The company’s post-2000 fall. 

After the pop in 2000, the stock price balanced out. No more steep climbs: the thrill ride became a lazy river through the lowlands. Investors who held for the climb, and the subsequent drop, expected another climb. But the thrill was gone; the ride wasn’t the same.  

graph shows a sharp peak and then a mostly stable path

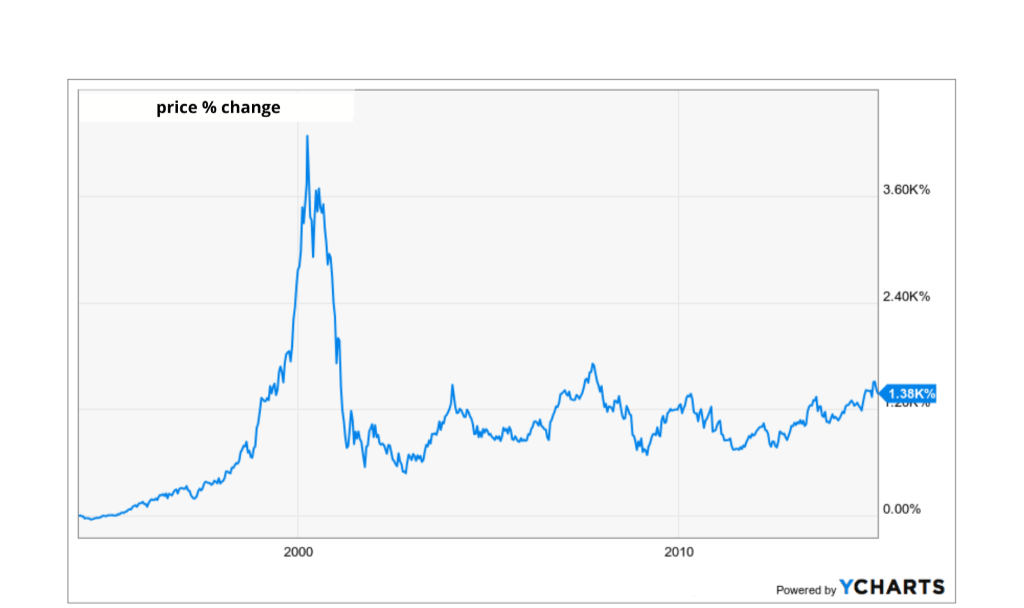
The map of the company’s whole ride. 

Okay, we’ll drop the coaster-cum-lazy-river comparison. You may have realized by this point that what we’ve just described is a historical example of a bubble: an excess of hype that ends with a pop! 

We mentioned that charts are maps of where things have been, so the lesson isn’t necessarily that they tell us where that specific thing is headed next… but they may be instructive in spotting similar rides in the future.  

Is it a thrill we’re game for? Or is it shaping up to be a thrill we’re not interested in, like the pop of a bubble? 

Clients, let us know when you have questions or want to hear more about what this all means for you. 


Want content like this in your inbox each week? Leave your email here

Can Haruspication Work For You?

© Can Stock Photo / DAIVI

We’re fairly certain we will meet one of our communication goals with this essay: to educate. We did not know the big word in the title until we went looking for it. If you knew it already, you are some kind of scholar.

Haruspication is one of many ways in which humans have attempted to divine the future. The practice came to ancient Rome from the Hittites via the Etruscans. It involved examining the entrails of animals that had been sacrificed to the gods for signs and portents. Perhaps it didn’t work that well, since the Hittites and the Etruscans haven’t been heard from for millennia.

In our day, technical analysts purport to be able to learn the future direction of investments by examining charts of various kinds. At the extreme, some say that fundamentals like earnings or financial statements or economic factors do not apply: everything one needs is supposed to be in the charts.

Our view is that facts matter, that understanding financial statements is important to investment analysis, that economic research has its place. By far the most important thing is to choose the questions you want to answer.

For a long term investor, the direction of the stock market or of any particular investment next week or next month or even next year is not all that pertinent. We already know that markets and investments go up and down; we also know what the underlying long term trend has been for many decades.

The questions we most want to answer are, where are the biggest bargains in today’s environment? Are there market stampedes we should avoid, or perhaps even go against? How can we own durable sources of investment income so we can live on our capital?

Neither haruspication nor technical chart analysis is likely to help you reach your goals. You may rely on us to do the work of reviewing quarterly reports, analyzing financial statements, studying economic developments, and thinking about trends in business and society—so that we can help you answer the important questions.

Please call if you would like to discuss your situation, and how our work might apply to it.


The opinions voiced in this material are for general information only and are not intended to provide specific advice or recommendations for any individual.

No strategy assures success or protects against loss.